When you log in to your account you will be redirected to the dashboard.
What does this page mean? What is its use?
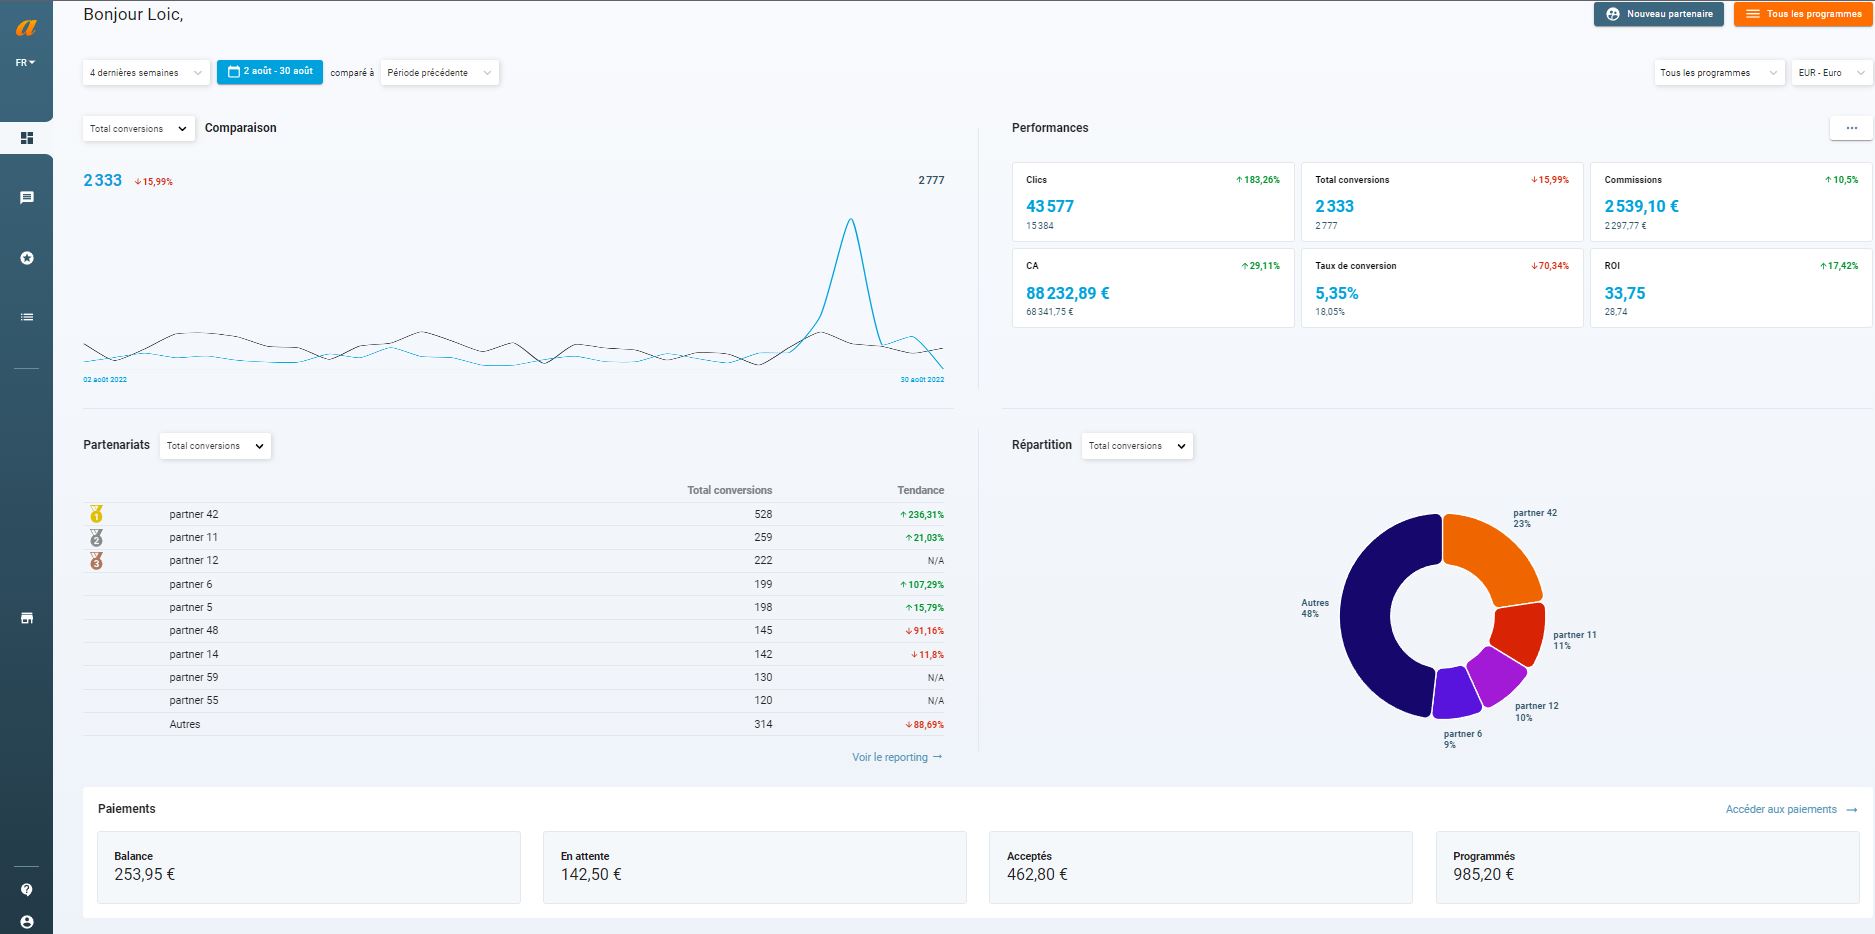
First of all, the dashboard is to be distinguished from the reporting. This is a snapshot of the performance of your program(s) at a precise moment.
Here is the detail of the different inserts available and how they work.
Access and selection of programs:
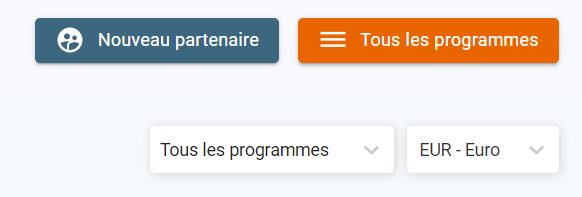
Located at the top right of the page, this insert offers several features.
- New partner : Allows direct access to the “my affiliates” section.
Please note that if you have multiple programs, this button will be grayed out and not clickable. It will then be necessary to select a particular program in the “ all programs ” filter.
- All programs : Allows you to access the list of all your programs.
- “All programs” filter : By default, the dashboard displays data for all of your programs and their partnerships. If you have several programs, you can decide to select only one or a part of them. The data will be automatically updated.
- Currency filter : This filter allows you to select a particular currency. By default, the currency displayed will be the one configured in the configuration of your first program.
Performance curve:
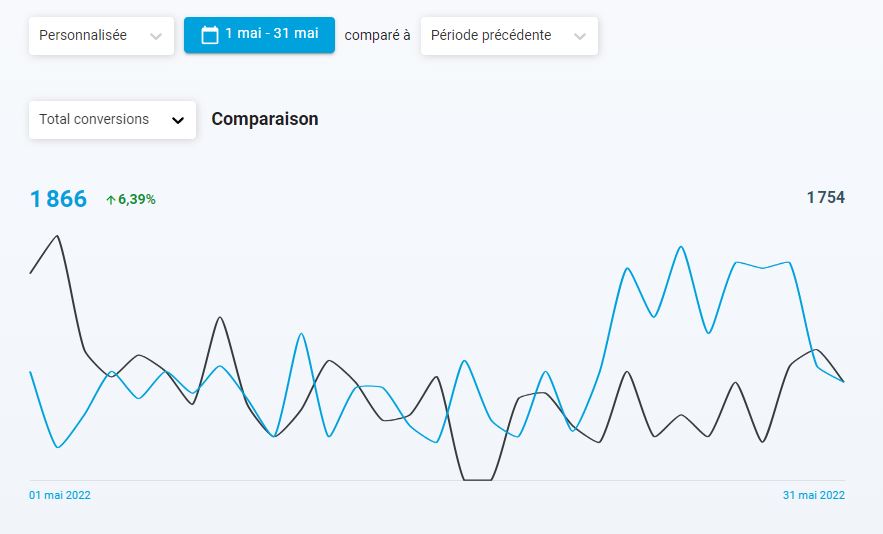
The curve shows you by default the conversions on all the partnerships of all your programs over the last 4 weeks compared to the previous 4 weeks.
You can freely decide to modify this period of analysis as well as the period compared via the filters provided for this purpose.
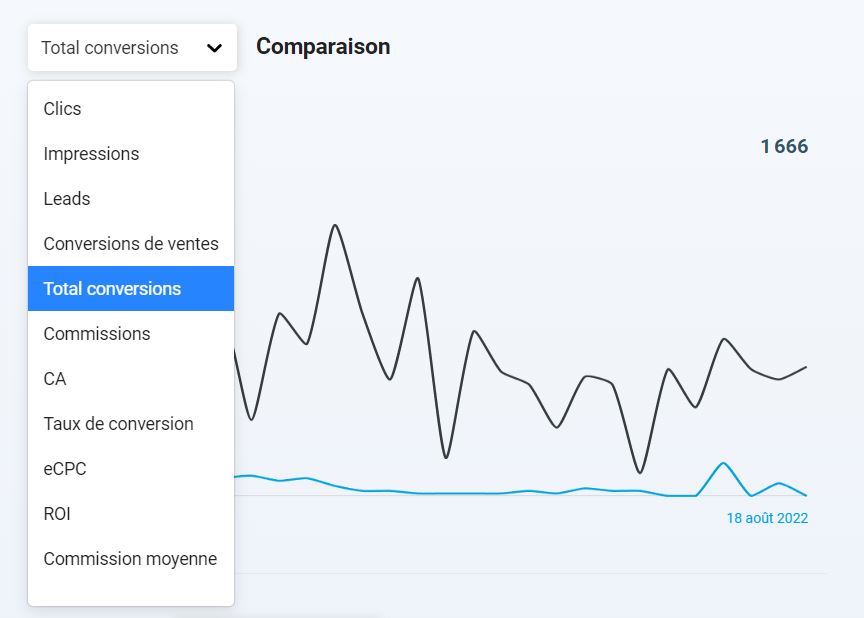
The curve displays conversion performance by default. You can also modify the information among 11 indicators by clicking on the filter.
“Performance” part:
This part will display 6 performance indicators for your program profile(s) over the selected period.
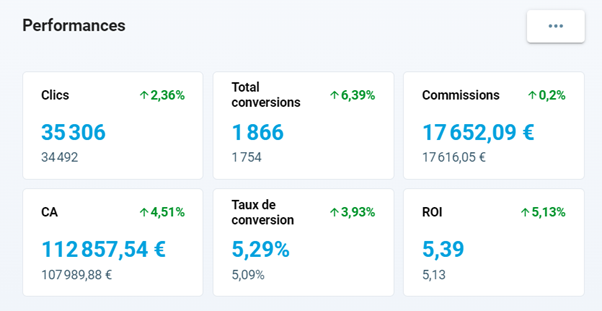
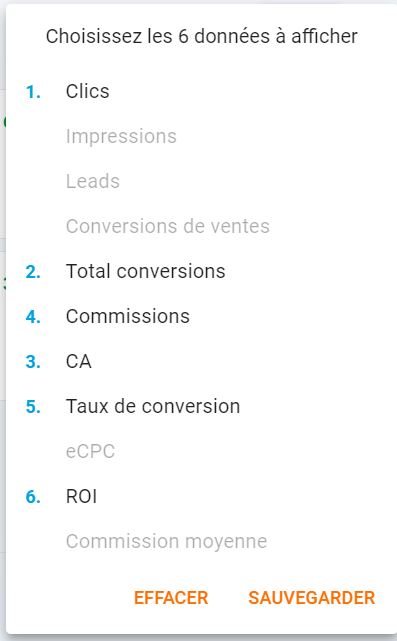
You can select 6 performance indicators to display by clicking on the three dots.
Part “partnerships”:
The part partnerships over the selected period the conversion performance of your partners of your program(s).
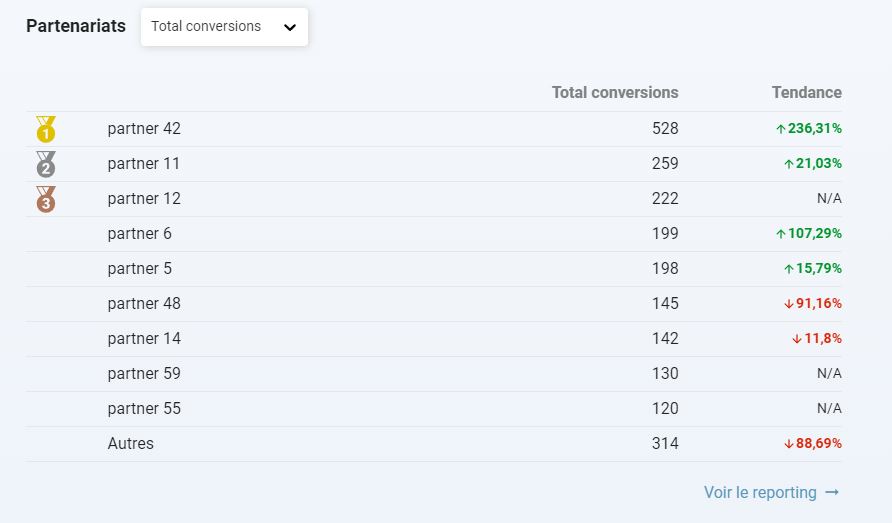
The top 9 most successful publishers plus a line for the rest of your partnerships will be displayed.
If you have less than 10 editors, the table adapts accordingly.
You can also decide to display another performance indicator via the filter provided for this purpose.
“Distribution” part:
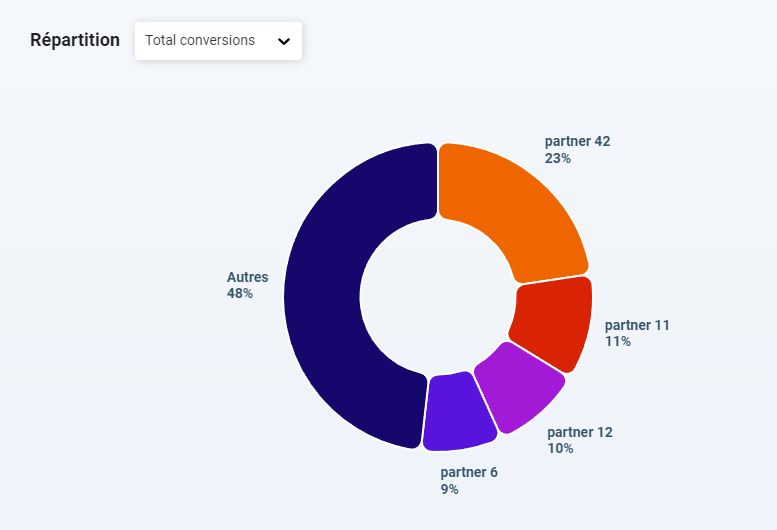
Identical to the “partnerships” part, the display of publisher performance is done in the form of a circular diagram.
Here you can also choose the KPI to display.
“Payments” part

Finally, you will find at the bottom of the page a detail concerning the payments.
Here is an explanation of the different inserts:
- Balance : Indicates the amount of commissions eligible for payment but which have not been invoiced. You can find these amounts from the “income” tab of the “payments” part of your interface.
- Pending : Invoices generated with the status “pending” therefore not yet validated by you.
- Accepted : Invoices that you have accepted. These have therefore been taken into account and the payment process should be underway on your side.
- Scheduled : Payment of the invoice(s) has been scheduled and you are telling publishers that they should receive their payments.
You now know how the dashboard works.
Was this article helpful?
That’s Great!
Thank you for your feedback
Sorry! We couldn't be helpful
Thank you for your feedback
Feedback sent
We appreciate your effort and will try to fix the article